
Welcome to Digital Knowledge Hub!
Are you getting lost in hundreds of rows of data or numbers in your spreadsheet? Making mistakes or wasting precious time calculating manually?
Don’t worry! By using 3 magical formulas in Google Sheets or Microsoft Excel, you can analyze any dataset in the blink of an eye. In today’s special guide, let’s explore these essential spreadsheet tricks!
📊 1. AVERAGE Function: Find Mean Values Effortlessly
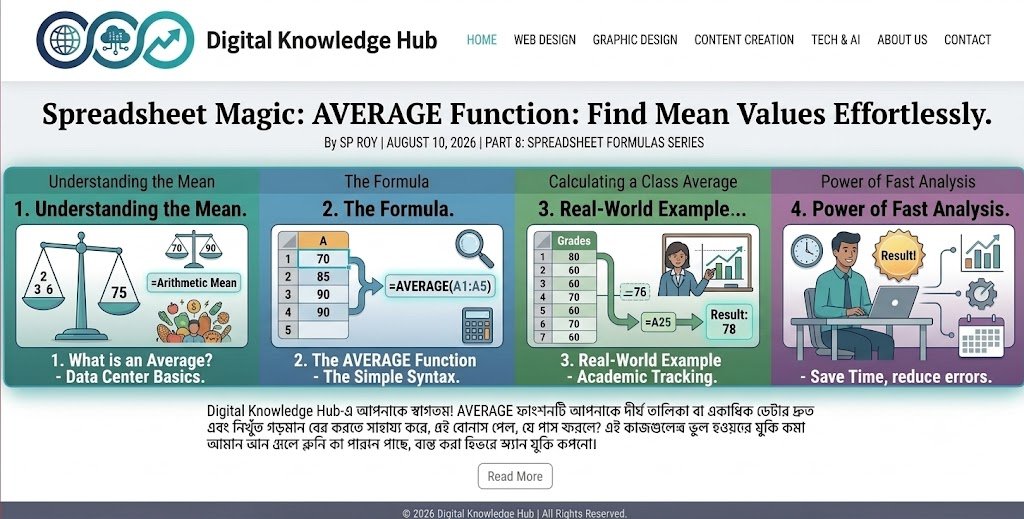
Calculating the average of a long list of numbers manually can be tedious and prone to simple calculation errors. The AVERAGE function automates this process by instantly calculating the arithmetic mean of a selected dataset.
🔍 How It Works: The AVERAGE function adds up all the numeric values within a specified range and divides the total sum by the count of those numeric entries.
Formula Syntax: =AVERAGE(range)
Example: =AVERAGE(A1:A10)
💡 Quick Example: If cells A1 through A5 contain test scores (70, 85, 90, 65, 80), typing =AVERAGE(A1:A5) instantly returns 78.
💼 Practical Use Cases: Academic Tracking: Calculate a student’s overall grade point average (GPA) or class averages across subjects.
Business Analytics: Determine average monthly sales revenue or average daily website visitor traffic.
Personal Finance: Track your average weekly spending on groceries or utilities to keep your budget on target.
⚡ Pro Tip
The AVERAGE function automatically ignores blank cells and text entries, ensuring your calculated mean remains accurate without requiring manual adjustments!
Dear Reader, not just numbers or data, but visual content is equally important in today’s digital world!
Do you want to present your information in front of everyone through beautiful graphics and excellent layouts? Then our next Graphic Design Series is for you! Join the Digital Knowledge Hub to learn the basic principles of design and unleash your creativity.